自転車でちょっと遠くまで出かける時、なるべく幹線道路を通らずに目的地まで行きたい
時間はかかるけど、新しい道を発見できるし、スピードが出ている車との並走が少ないので気分的にだいぶ楽
迷った時など細いところはiPhoneで確認しますが、大まかな感じは紙の地図があるとやはり便利です。
以前はMapFanの「ギュッ!と印刷」機能を使ってA4に印刷したものを使っていたのですが、いつからか利用できなく?なってしまったようで、Google マップに変えました。
しかしこのGoogle マップ、印刷すると道路が白すぎてよく見えません。
どうにかならないかとググってみたところ
Styled Maps Wizardを使って取得したコードを利用すればカスタマイズできるということで、
Google Maps API Styled Map Wizardのページにアクセスしたら、右上の「場所を入力」フィールドに、表示させたい場所を入力
今回は道路の色を変えるので
SelectorsのFeature type All » Road » Localを選択して
Colorチェックボックスにチェックを入れて、色を調整。
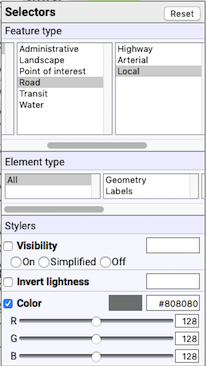
幹線道路も変更するので
Map Styleの右上の「Add」ボタンをクリック
Style 1が追加されるので、Style 1が選択されているのを確認
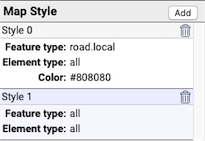
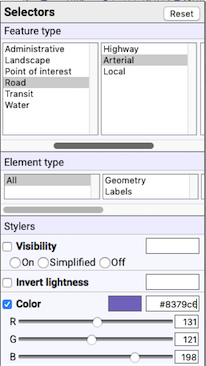
SelectorsのFeature type All » Road » Arterialを選択して
Colorチェックボックスにチェックを入れて、色を調整。
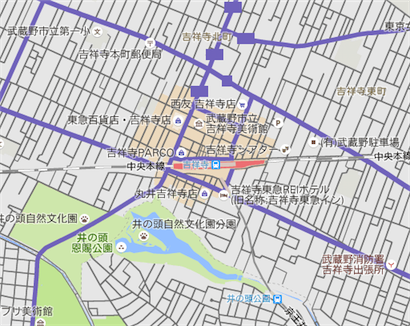
こんな感じになりました。
問題なければ、Map Styleウインドウ下の「Show JSON」ボタンをクリック
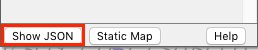
表示されたものをコピーしておく。
Google Maps API v3 Styled Maps JSON
[
  {
    "featureType": "road.local",
    "stylers": [
      { "color": "#808080" }
    ]
  },{
    "featureType": "road.arterial",
    "stylers": [
      { "color": "#8379c6" }
    ]
  }
]
APIキーの取得
Google Mapsの利用にはAPIキーが必要なので、まだの場合はAPIキーを取得する
JavaScript API のキーを取得する | Google Maps JavaScript API | Google Developersのページの手順に従ってAPI キーを取得
Google Maps の APIキー を簡単に取得する – ねんでぶろぐのページがわかりやすいです。
APIキーの準備が出来たら、ファイルの作成
スタイル化されたマップ | Google Maps JavaScript API | Google Developersのページの「StyledMapType を作成する」を参考に
function initialize() {

  // Create an array of styles.
  var styles = [
    {
      "featureType": "road.local",
      "stylers": [
        { "color": "#808080" }
      ]
    },{
      "featureType": "road.arterial",
      "stylers": [
        { "color": "#8379c6" }
      ]
    }
  ];

  // Create a new StyledMapType object, passing it the array of styles,
  // as well as the name to be displayed on the map type control.
  var styledMap = new google.maps.StyledMapType(styles,
    {name: "Styled Map"});

  // Create a map object, and include the MapTypeId to add
  // to the map type control.
  var mapOptions = {
    zoom: 16, // 拡大比率
    center: new google.maps.LatLng(35.703760, 139.579430), //中心座標
    mapTypeControlOptions: {
      mapTypeIds: [google.maps.MapTypeId.ROADMAP, 'map_style']
    }
  };
  var map = new google.maps.Map(document.getElementById('map'),
    mapOptions);

  //Associate the styled map with the MapTypeId and set it to display.
  map.mapTypes.set('map_style', styledMap);
  map.setMapTypeId('map_style');
}
center: new google.maps.LatLng();には、表示する中心座標を
表示する中心座標を取得するには
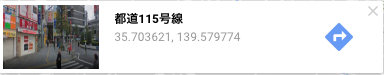
Google マップでデフォルトで表示させたい場所を検索したら、中心部分を右クリックして「この場所について」を選択
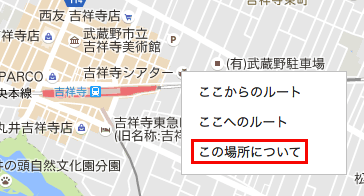
画面下部に詳細情報を記したカードが表示されます。
表示された座標をコピーしておく
var map = new google.maps.Map(document.getElementById(‘map’),
mapOptions);の、getElementByIdで設定した名前(ここでは map)は、htmlファイルのdiv id=で同じものを設定します。
出来上がったら、任意の名前(ここではgmap.js)で保存(UTF-8、改行LF)
htmlファイルの作成(A4で印刷するので高さと幅はこのくらいの大きさがいいかも)
<!DOCTYPE html PUBLIC "-//W3C//DTD XHTML 1.0 Transitional//EN" "http://www.w3.org/TR/xhtml1/DTD/xhtml1-transitional.dtd">
<html xmlns="http://www.w3.org/1999/xhtml" xml:lang="ja" lang="ja">
<head>
<meta http-equiv="Content-Type" content="text/html; charset=UTF-8" />
<meta http-equiv="Content-Style-Type" content="text/css" />
<meta http-equiv="Content-Script-Type" content="text/javascript" />
                <script type="text/javascript" src="http://maps.googleapis.com/maps/api/js?sensor=true&key=取得したAPIキー"></script>
<script type="text/javascript" src="gmap.js"></script>
</head>
<body onload="initialize();">
        <div id="map" style="width: 100%; height: 842px; margin: 10px 0;"></div>
</body>
</html>
src=”http://maps.googleapis.com/maps/api/js?sensor=true&key=取得したAPIキー”
<script type=”text/javascript” src=”gmap.js”></script>のgmap.jsは作成したStyledMapTypeのファイル名
出来上がったら、任意の名前(ここではgmap.html)で保存(UTF-8、改行LF)
作成した2つのファイル(gmap.html、gmap.js)をFTPソフトなどを使って、ホームページにアップしてブラウザで確認
あとは移動させたり大きさを変更したりして、印刷する部分が確定したら、ブラウザのプリントメニューからそのまま印刷をするか、「Shift + Command + 4」で選択保存して、プレビュー等で開いて印刷を(もっとスマートな方法があるような)
あとは、曲がるところや迷いそうなところに印や注釈をつけておけばOK :wink_wp:
追記
デフォルトのサイズからのズームアウトは問題ありませんが、ズームインすると色が消えてしまうようです。
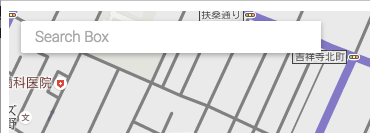
さらに追記
左上の地図というマップタイプコントールを消して、検索ボックスを表示してみました。(だいぶ適当ですが)
Places search box | Google Maps JavaScript API | Google Developers
gmap.html
<!DOCTYPE html PUBLIC "-//W3C//DTD XHTML 1.0 Transitional//EN" "http://www.w3.org/TR/xhtml1/DTD/xhtml1-transitional.dtd">
<html xmlns="http://www.w3.org/1999/xhtml" xml:lang="ja" lang="ja">
<head>
<meta http-equiv="Content-Type" content="text/html; charset=UTF-8" />
<meta http-equiv="Content-Style-Type" content="text/css" />
<meta http-equiv="Content-Script-Type" content="text/javascript" />
                <script type="text/javascript" src="http://maps.googleapis.com/maps/api/js?sensor=true&key=取得したAPIキー&libraries=places"></script>
<script type="text/javascript" src="gmap.js"></script>
<style>
.controls {
  margin-top: 10px;
  border: 1px solid transparent;
  border-radius: 2px 0 0 2px;
  box-sizing: border-box;
  -moz-box-sizing: border-box;
  height: 32px;
  outline: none;
  box-shadow: 0 2px 6px rgba(0, 0, 0, 0.3);
}

#pac-input {
  background-color: #fff;
  font-family: Roboto;
  font-size: 15px;
  font-weight: 300;
  margin-left: 12px;
  padding: 0 11px 0 13px;
  text-overflow: ellipsis;
  width: 300px;
}
</style>
</head>
<body onload="initialize();">
        <input id="pac-input" class="controls" type="text" placeholder="Search Box">
        <div id="map" style="width: 100%; height: 842px; margin: 10px 0;"></div>
</body>
</html>
gmap.js
function initialize() {

  // Create an array of styles.
  var styles = [
    {
      "featureType": "road.local",
      "stylers": [
        { "color": "#808080" }
      ]
    },{
      "featureType": "road.arterial",
      "stylers": [
        { "color": "#8379c6" }
      ]
    }
  ];

  // Create a new StyledMapType object, passing it the array of styles,
  // as well as the name to be displayed on the map type control.
  var styledMap = new google.maps.StyledMapType(styles,
    {name: "Styled Map"});

  // Create a map object, and include the MapTypeId to add
  // to the map type control.
  var mapOptions = {
    zoom: 16, // 拡大比率
    center: new google.maps.LatLng(35.703760, 139.579430), // 中心座標
    mapTypeControl: false,
    mapTypeControlOptions: {
      mapTypeIds: [google.maps.MapTypeId.ROADMAP, 'map_style']
    }
  };
  var map = new google.maps.Map(document.getElementById('map'),
    mapOptions);

  //Associate the styled map with the MapTypeId and set it to display.
  map.mapTypes.set('map_style', styledMap);
  map.setMapTypeId('map_style');

  // Create the search box and link it to the UI element.
  var input = document.getElementById('pac-input');
  var searchBox = new google.maps.places.SearchBox(input);
  map.controls[google.maps.ControlPosition.TOP_LEFT].push(input);

  // Bias the SearchBox results towards current map's viewport.
  map.addListener('bounds_changed', function() {
    searchBox.setBounds(map.getBounds());
  });

  var markers = [];
  // Listen for the event fired when the user selects a prediction and retrieve
  // more details for that place.
  searchBox.addListener('places_changed', function() {
    var places = searchBox.getPlaces();

    if (places.length == 0) {
      return;
    }

    // Clear out the old markers.
    markers.forEach(function(marker) {
      marker.setMap(null);
    });
    markers = [];

    // For each place, get the icon, name and location.
    var bounds = new google.maps.LatLngBounds();
    places.forEach(function(place) {
      var icon = {
        url: place.icon,
        size: new google.maps.Size(71, 71),
        origin: new google.maps.Point(0, 0),
        anchor: new google.maps.Point(17, 34),
        scaledSize: new google.maps.Size(25, 25)
      };

      // Create a marker for each place.
      markers.push(new google.maps.Marker({
        map: map,
        icon: icon,
        title: place.name,
        position: place.geometry.location
      }));

      if (place.geometry.viewport) {
        // Only geocodes have viewport.
        bounds.union(place.geometry.viewport);
      } else {
        bounds.extend(place.geometry.location);
      }
    });
    map.fitBounds(bounds);
  });

 }
こんな感じで表示されます。

コメント